CPA Firm KPIs: 15 Metrics, Formulas, and Benchmarks for 2026

Summary
Learn how to measure 15 essential CPA firm KPIs covering profitability, productivity, staffing capacity, client health, turnaround time, and delivery quality. This guide provides formulas, working benchmark ranges, dashboard fields, and a practical method for diagnosing performance and capacity constraints.
What Are CPA Firm KPIs?
CPA firm KPIs are measurable indicators of how effectively an accounting practice turns people, time, pricing, and client relationships into profitable, timely work. A useful scorecard combines financial, productivity, client, and delivery metrics. It does not treat billable hours as the whole story.
The 15 CPA firm KPIs in this guide are revenue per partner, revenue per employee, revenue per FTE by service line, realization rate, utilization rate, effective billing rate, profit margin, client retention rate, Net Promoter Score, average revenue per client, client concentration risk, turnaround time, error rate, leverage ratio, and cost per engagement.
For every KPI, use one written definition, one formula, one source system, one owner, and one review cadence. Compare the result with the firm's history before drawing conclusions from a general benchmark.
- Read economics and delivery together. High utilization is not healthy if realization, turnaround, or quality deteriorates.
- Give each dashboard a decision. Partners and managers need different views.
- Separate internal processing from client waiting time so the firm can see the real bottleneck.
- Use benchmarks as starting references, then adjust for firm size, service mix, geography, seasonality, and structure.
What Should a CPA Firm Dashboard Show for Staff Workload and Client Turnaround?
A CPA firm workload and turnaround dashboard should show the engagement owner, preparer, reviewer, due date, current stage, days in stage, missing client information, available staff capacity, review status, and expected completion. It should separate preparation time, review time, and client waiting time.
| Dashboard view | KPIs and workflow fields | Decision it should support |
|---|---|---|
| Partner | Revenue per partner, margin, realization, leverage, retention, and concentration | Pricing, capacity, service mix, and risk |
| Manager | Utilization, workload, due dates, stage, turnaround, review queue, errors, and cost per engagement | Allocation, bottlenecks, training, and deadline risk |
| Team | Assigned work, capacity, due dates, open dependencies, status, and review feedback | Daily priorities and early escalation |
Staff-level scorecards should emphasize measures employees can control, such as timely completion, defined quality, review feedback, and workload visibility. Firm margin and revenue per partner remain management measures.
Use the practice-management system for time and billing, the workflow platform for stage and due-date data, the accounting system for financial results, and a consistent feedback process for client sentiment. Identify which system controls each field so two reports do not produce two answers.
If recurring dashboard production is consuming manager time, KPI dashboard and management reporting support can add reporting capacity after the firm defines its metrics, sources, and review rules.
Make your KPI dashboard easier to act on.
Get the scorecard with KPI formulas, owners, targets, trends, and next actions.
How Do You Measure Accounting Firm Productivity?
Measure accounting firm productivity with revenue per partner, revenue per employee, utilization, realization, turnaround time, and error rate together. No single metric is enough because higher billable hours can coexist with slower delivery or more rework.
| Management question | KPIs to read together | What the pattern reveals |
|---|---|---|
| Is busy time becoming profitable work? | Utilization, realization, effective billing rate, and margin | Whether effort becomes collected revenue and profit |
| Are partners operating at the right level? | Revenue per partner, leverage, and review workload | Whether delegation releases or consumes partner capacity |
| Is work moving efficiently? | Turnaround, error rate, and cost per engagement | Whether speed comes from a sound process or creates rework |
| Is growth healthy? | Revenue per client, retention, concentration, and margin | Whether growth is durable, diversified, and profitable |
Accounting Firm KPI Benchmarks: Quick Reference
Benchmark CPA firm KPIs in this order: the firm's prior periods, its budget and targets, a peer group matched for size, region, and service mix, and then broader industry data. The numerical ranges below are working references, not figures attributed to the AICPA MAP Survey. The AICPA National MAP Survey can support a more relevant peer comparison.
| CPA firm KPI | Formula | Working reference range |
|---|---|---|
| Revenue per partner | Firm revenue / average equity partners | $500,000 to $800,000 for small firms; $800,000 to $1,500,000 for midsize firms; $1,500,000 or more for large firms |
| Revenue per employee | Firm revenue / average FTEs | $120,000 to $180,000 per FTE |
| Revenue per FTE by service line | Service-line revenue / service-line FTEs | Compare internally by service line and over time |
| Realization rate | Collected revenue / standard value of work × 100 | 85% to 95% is healthy; below 80% needs investigation |
| Utilization rate | Billable hours / available hours × 100 | Partners: 55% to 65%; managers: 70% to 80%; staff: 80% to 90% |
| Effective billing rate | Collected revenue / billable hours | Staff: $150 to $250 per hour; managers: $200 to $400; partners: $300 to $600 |
| Profit margin | Net income / total revenue × 100 | 25% to 40% is healthy; below 20% needs investigation |
| Client retention rate | Retained clients / clients at the start of the period × 100 | 90% to 95% or higher is healthy; below 85% needs investigation |
| Net Promoter Score | Percentage of promoters minus percentage of detractors | 50 or higher is excellent for professional services |
| Average revenue per client | Firm revenue / average active clients | Compare with the firm's history and service mix |
| Client concentration risk | Revenue from selected top clients / firm revenue × 100 | No single client above 10% to 15%; top 10 below 40% to 50% |
| Turnaround time | Total completion days / completed engagements | Set by engagement type and compare with the firm's baseline |
| Error rate | Deliverables returned with defined errors / total deliverables × 100 | Below 5% is healthy; below 2% is excellent |
| Leverage ratio | Professional staff / average equity partners | 4:1 to 8:1 for most firms |
| Cost per engagement | Direct labor cost, including review + software cost + allocated delivery overhead | Compare by engagement type, client, and period |
Use one definition consistently. Decide which employees belong in each FTE measure, whether margin is before or after partner compensation, when an engagement starts and stops, how client waiting time is treated, and what counts as an error. This guide uses a collection-adjusted realization calculation based on collected revenue. Report billing realization and collection realization separately when the firm needs to identify whether value is lost before or after invoicing.
Revenue and Productivity KPIs
1. Revenue per Partner
Formula: Firm revenue / average equity partners. It shows the revenue supported by each owner. Read it with leverage and partner workload because a high result can conceal overload or weak delegation.
2. Revenue per Employee
Formula: Firm revenue / average FTEs. Use average headcount for the period. Read it with margin, turnaround, and errors to distinguish genuine efficiency from an unsustainable workload.
3. Revenue per FTE by Service Line
Formula: Service-line revenue / service-line FTEs. Compare tax, audit, accounting, payroll, and advisory separately, using one consistent allocation method for employees who support several departments.
Profitability and Capacity KPIs
4. Realization Rate
Formula: Collected revenue / standard value of work × 100. Investigate write-downs, scope creep, pricing, time capture, and collections separately because each problem requires a different response.
5. Utilization Rate
Formula: Billable hours / available hours × 100. Review it by role and season. High utilization with slower turnaround, a larger review queue, or more errors is a capacity warning.
6. Effective Billing Rate
Formula: Collected revenue / billable hours for the same period. Compare effective and standard rates by service line and engagement type to find under-scoping or inconsistent billing decisions.
7. Profit Margin
Formula: Net income / total revenue × 100. Define the treatment of partner compensation and apply it consistently. Diagnose pricing, rework, staffing, overhead, and service mix before changing headcount.
Client Health KPIs
8. Client Retention Rate
Formula: Retained clients / clients at the start of the period × 100. Segment it by service line, client value, and departure reason so deliberate pruning is not confused with service failure.
9. Net Promoter Score
Formula: Percentage of promoters minus percentage of detractors. Keep the question, timing, and respondent group consistent, then read the comments and follow up on the issues behind the score.
10. Average Revenue per Client
Formula: Firm revenue / average active clients. A rising average may reflect pricing, broader services, or larger clients. Pair it with profitability, retention, and partner time.
11. Client Concentration Risk
Formula: Revenue from selected top clients / firm revenue × 100. Concentration can absorb reviewer capacity, shape hiring, and disrupt the practice if a major relationship ends during a busy period.
Delivery KPIs
12. Turnaround Time
Formula: Total completion days / completed engagements. Define the start and finish, then separate preparation, review, and client waiting time to locate the actual delay.
13. Error Rate
Formula: Deliverables returned with defined errors / total deliverables × 100. Separate material errors, review notes, and changed instructions. Use patterns to improve training, documentation, and workflow.
14. Leverage Ratio
Formula: Professional staff / average equity partners. Define which roles count as professional staff. Higher leverage helps only when delegation is clear and review does not create more coordination work.
15. Cost per Engagement
Formula: Direct labor cost, including review + software cost + allocated delivery overhead. Use one costing method for comparable work, then read the result with realization, errors, and reviewer time.
How Should a CPA Firm Owner Read KPI Combinations?
No single KPI diagnoses a firm's problem. The useful signal usually comes from related metrics moving together.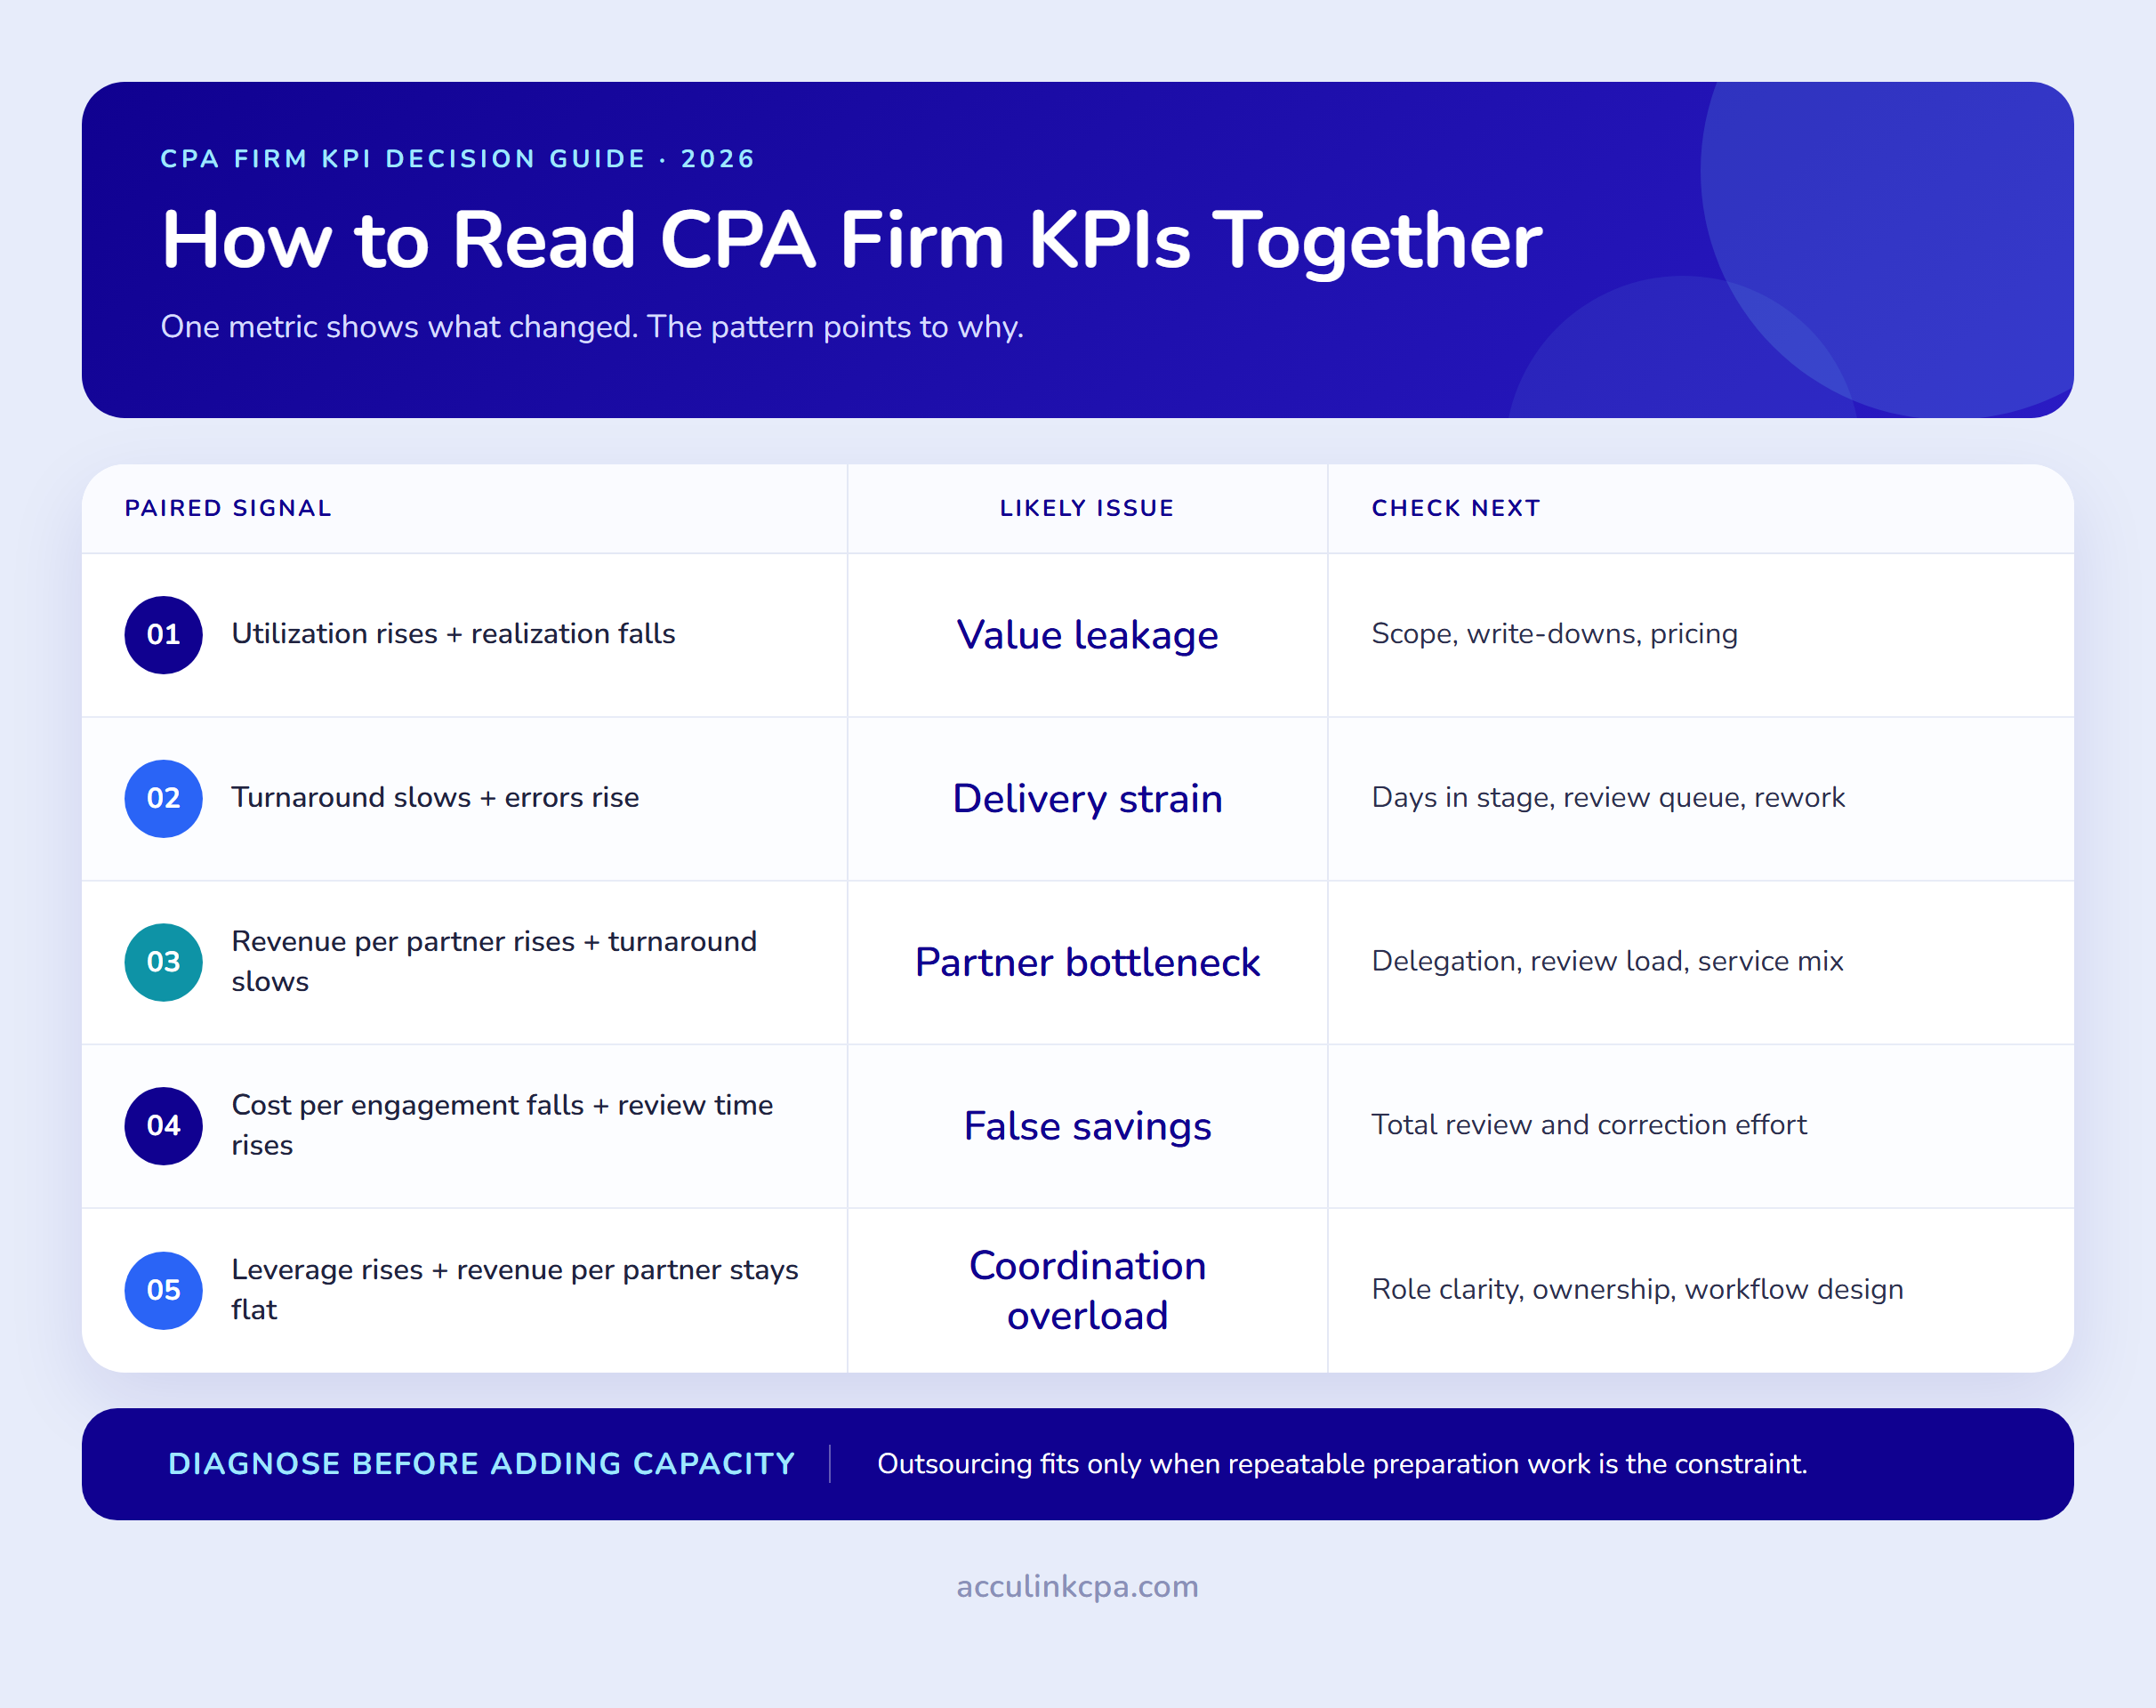
| KPI pattern | What it may mean | What to investigate first |
|---|---|---|
| Utilization rises while realization falls | More hours are not becoming collected value | Scope, rework, write-downs, pricing, and time capture |
| Turnaround slows while errors rise | Preparation or review capacity may be overloaded | Days in each stage, documentation, reviewer queue, and training |
| Revenue per partner rises while turnaround worsens | Growth may be coming from partner overload | Delegation, partner preparation time, review load, and service mix |
| Cost per engagement falls while review time rises | Apparent savings may be absorbed by rework | Total review and correction effort on equivalent work |
| Average revenue per client rises while retention weakens | Pricing or expansion may be harming client fit | Departures by service line, client type, and reason |
| Leverage rises without higher revenue per partner | More staff may be adding coordination rather than capacity | Role clarity, delegation, review ownership, and workflow design |
The dashboard should not merely label a number good or bad. It should identify the next question, responsible owner, and management action.
How Should CPA Firms Set KPI Targets and Trust the Data?
Assign a definition, formula, source, owner, cadence, and required response to every KPI. Use minimum acceptable, target, and stretch levels. For realization, a working example is 80% minimum, 90% target, and 95% stretch.
Review operational measures monthly, financial measures quarterly, and strategic measures annually, but investigate a material adverse trend sooner. IFAC's KPI monitoring and benchmarking guidance recommends selecting firm-level drivers and cascading relevant measures to departments and individuals.
Before trusting the dashboard, check missing time, inconsistent statuses, inactive clients, duplicate records, shifting allocations, and changing error definitions. Buying better dashboard software cannot correct undefined metrics or unreliable inputs.
When Does a KPI Problem Point to Outsourcing?
A KPI problem points to outsourcing when demand is healthy, the work is repeatable and documented, and preparation capacity is constraining turnaround, leverage, or cost per engagement. Fix the internal process first when the root cause is underpricing, unclear scope, missing client records, unreliable source data, or inconsistent review rules.
Before work moves, baseline the relevant core KPIs, including turnaround, error rate, cost per engagement, utilization, and leverage. Also record supporting diagnostic evidence such as reviewer time, rework, missed deadlines, security exceptions, and available domestic capacity. Compare equivalent engagements after implementation. A lower preparation cost is not a successful result if manager review time, rework, or deadline risk increases.
Map preparation, review, sign-off, and client dependencies using the accounting outsourcing process. Verify ownership, access, continuity, evidence, and exit requirements with the CPA-firm vendor due diligence checklist. The accounting outsourcing data-security guide covers the evidence behind security-related findings.
The right capacity model depends on what the dashboard reveals:
- For a defined workflow with agreed inputs, outputs, and review points, explore accounting outsourcing services.
- For a named professional working inside the firm's process, evaluate a dedicated offshore accountant.
- For a constraint spanning several workflows or roles, consider a dedicated offshore team.
Is capacity the bottleneck your dashboard is revealing? Bring the workflow, backlog, current turnaround, cost per engagement, error rate, and review constraint. Request a workload and workflow review with Acculink without sharing confidential client records.
Frequently Asked Questions
What does CPA KPI mean?
A CPA KPI is a key performance indicator that connects a defined measure of an accounting firm's financial, productivity, client, or delivery performance to a management decision.
What are the most important KPIs for a CPA firm?
Start with revenue per partner, realization, utilization, profit margin, client retention, turnaround, and error rate. Together they show productivity, pricing, capacity, client health, speed, and quality.
How often should an accounting firm review KPIs?
Review operational KPIs monthly, financial KPIs quarterly, and strategic KPIs annually. Escalate a significant adverse trend sooner rather than waiting for the next meeting.
Are marketing KPIs part of this 15-metric CPA firm scorecard?
No. Marketing and acquisition measures belong on a separate growth dashboard. Connect that view to revenue per client, retention, concentration, and margin so the firm does not reward unprofitable growth.
What is a good profit margin for a CPA firm?
A working reference range is 25% to 40%, with results below 20% requiring investigation. Compare it with similar firms, the service mix, compensation treatment, and the firm's own trend.
How should a CPA firm evaluate an outsourced provider using these KPIs?
Establish a baseline for turnaround, error rate, cost per engagement, utilization, leverage, and profit margin. Review notes, rework, missed deadlines, manager time, and security exceptions are diagnostic evidence explaining why a core KPI changed.
The Bottom Line
The best CPA firm KPI system is not the one with the most charts. It shows where revenue, capacity, quality, and client service are changing, identifies the likely cause, assigns an owner, and prompts a decision.
Start with a consistent scorecard and baseline. Add detail only when it helps partners and managers take a better action.
See what your KPIs are telling you about capacity.
Bring your backlog, turnaround, error rate, and review constraint. We will help you scope the right support.
Tags:
About the Author

Related Posts

Top Tax Outsourcing Companies for CPA and Accounting Firms (2026 Rankings)
The top tax outsourcing companies for CPA firms in 2026 are Acculink CPA, QX Accounting Services, CapActix, Da…

Tax Preparation Outsourcing for CPA Firms: How It Works, What It Costs, and Where to Start (2026)
Tax preparation outsourcing lets a CPA firm hand routine return preparation to an external team, usually offsh…

Top 10 Offshore Staffing Companies for Accounting Firms (2026)
Hiring an offshore team is one of the highest-leverage moves a short-staffed CPA firm can make, but the partne…